Healthcare Accessibility, Mental Health Resources, Population Density, Educational Level, Median Income, Insurance Coverage, Spatial Analysis, Story Map
Tools:
ArcGIS Online, ArcGIS Pro, Python, Google Place API, Tableau
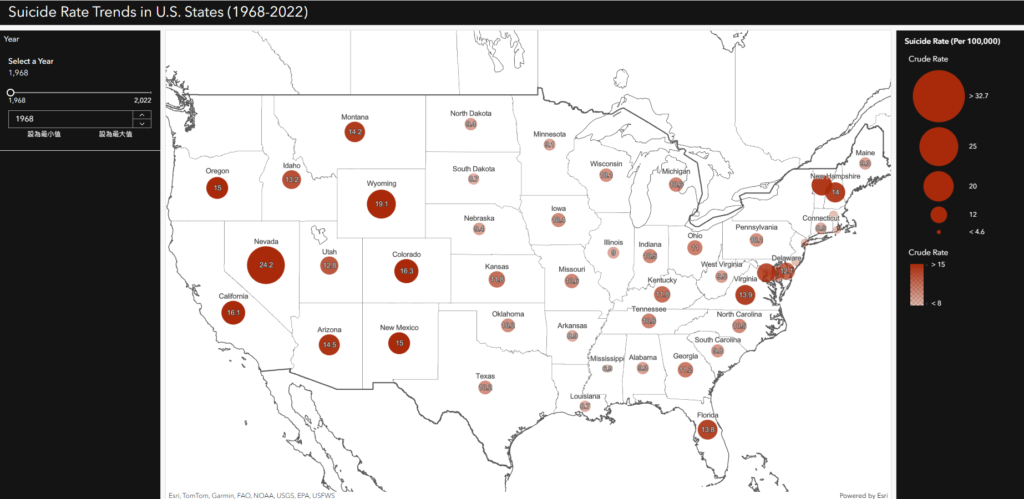
Research indicates that the suicide rate in the United States has been steadily increasing over the years. To explore this trend, I created a dashboard and Tableau visualizations that illustrate the rising suicide rates across different states. However, an interesting anomaly emerged—despite being a densely populated metropolis, New York City has a significantly lower suicide rate compared to other states.
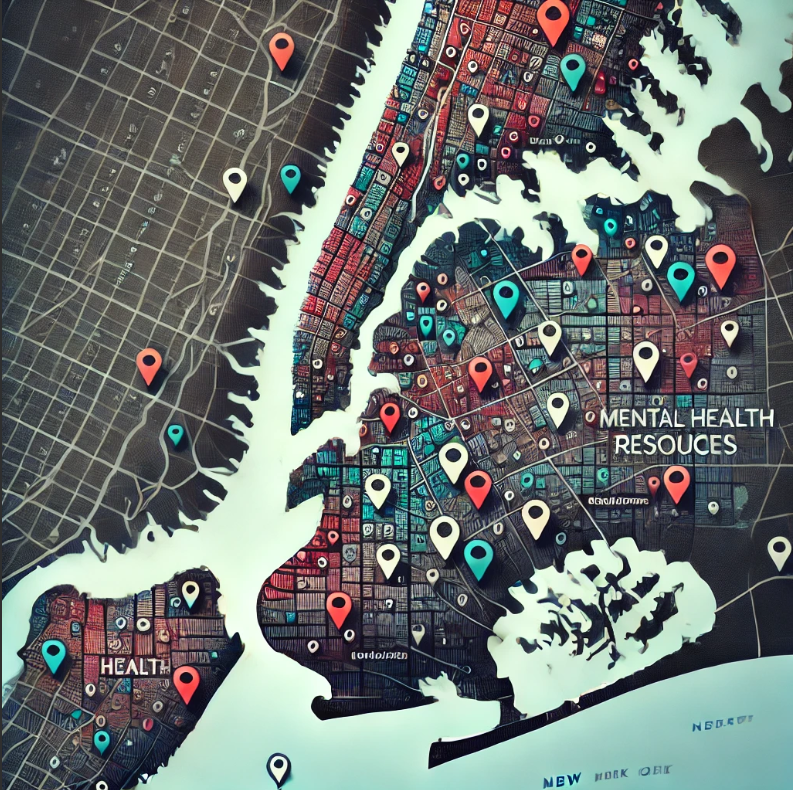
I hypothesize that this could be attributed to the availability of mental health resources in New York City, which may play a crucial role in providing support and intervention. Motivated by this observation, I decided to analyze the spatial distribution of mental health resources in NYC and examine their relationship with key socioeconomic factors, including population density, educational attainment, health insurance coverage, and median household income. Through this analysis, I aim to identify areas with high mental health needs but limited access to resources, providing insights into potential gaps in service availability.
A dashboard visualizing suicide rate trends across U.S. states from 1968 to 2022.
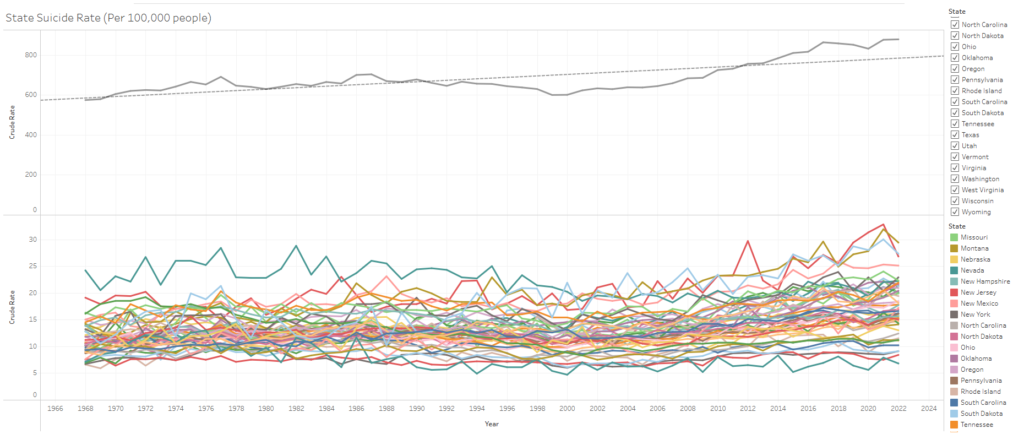
A Tableau visualization displaying the historical trends of state-level suicide rates from 1968 to 2022.
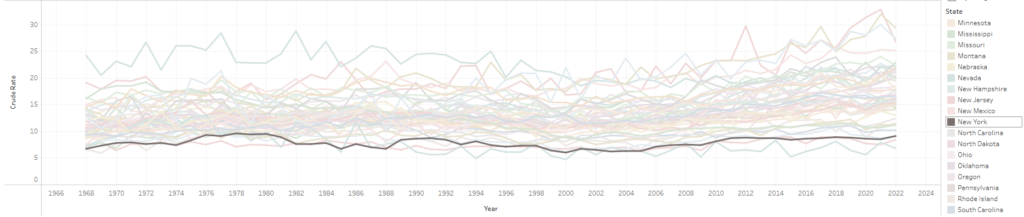
This visualization highlights New York’s suicide rate trend, which is lower than that of other states.
Approach & Design
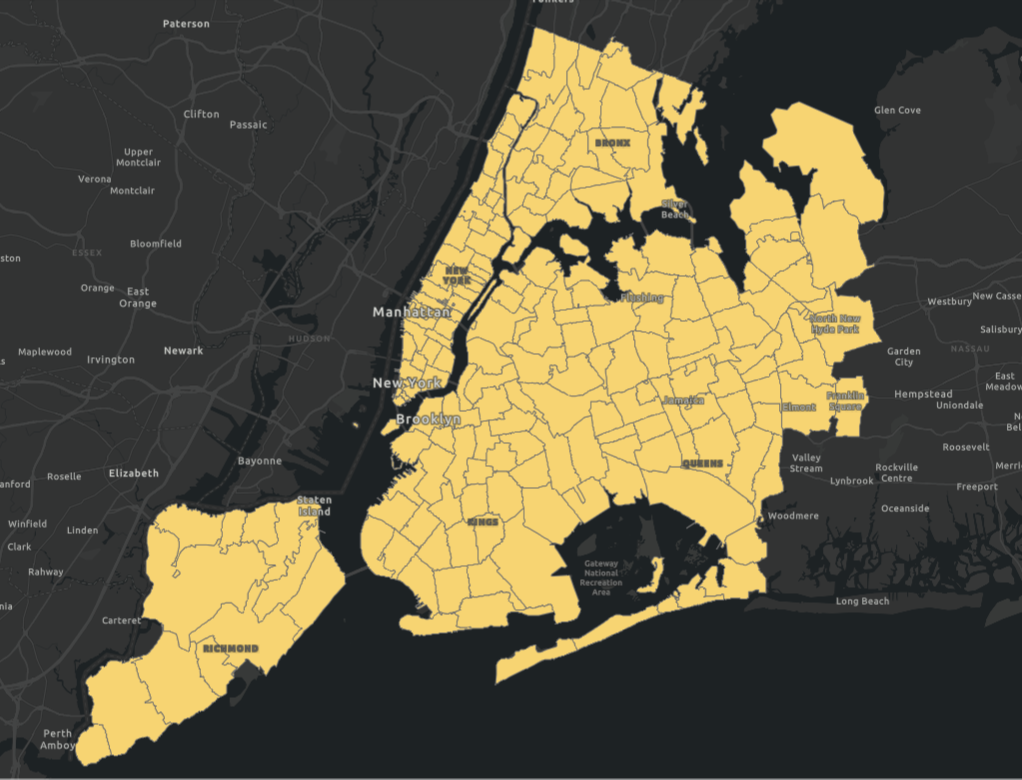
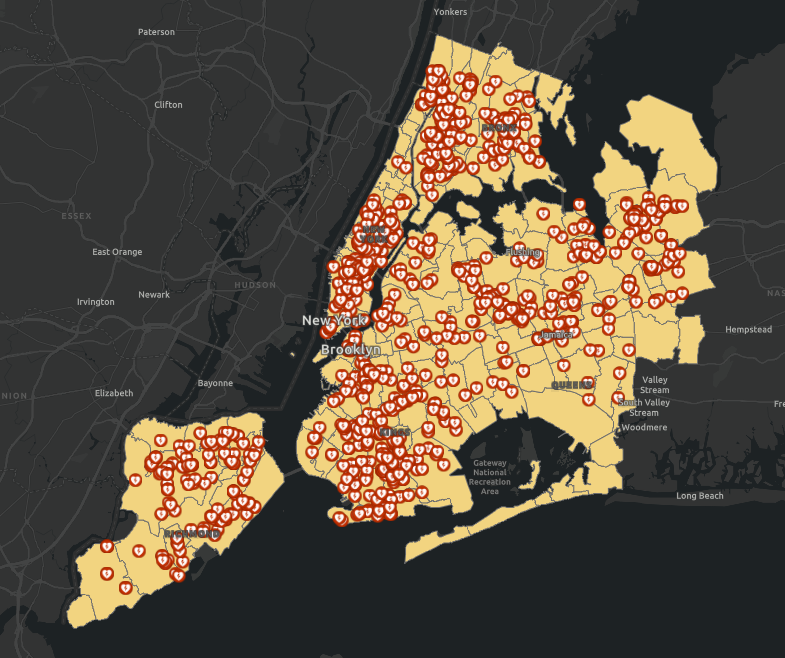
I used ZIP code areas to divide New York City into smaller regions, allowing for a more granular analysis. To gather mental health resource locations, I utilized the Google Places API to search for relevant facilities across NYC and mapped them to visualize their distribution.
The complete code for the API search process is available HERE
New York City Divided by ZIP Code Areas.
Distribution of Mental Health Resources in New York City.
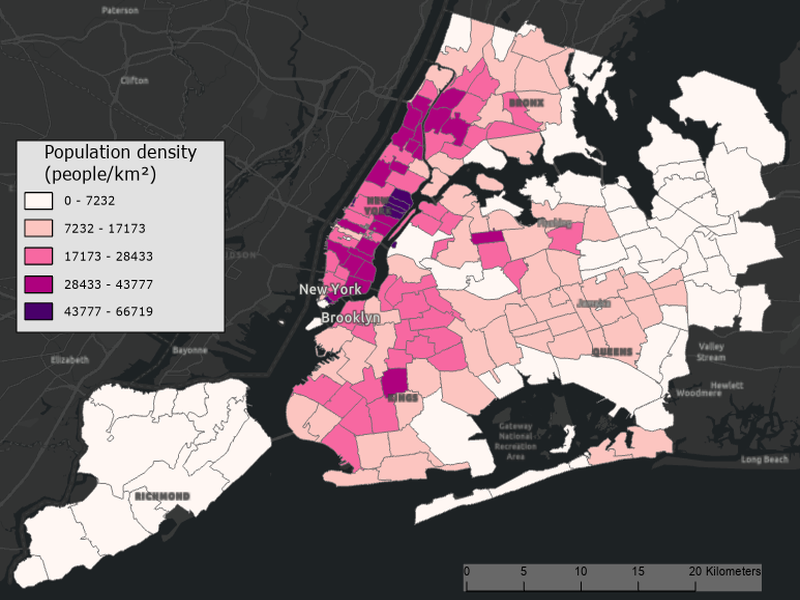
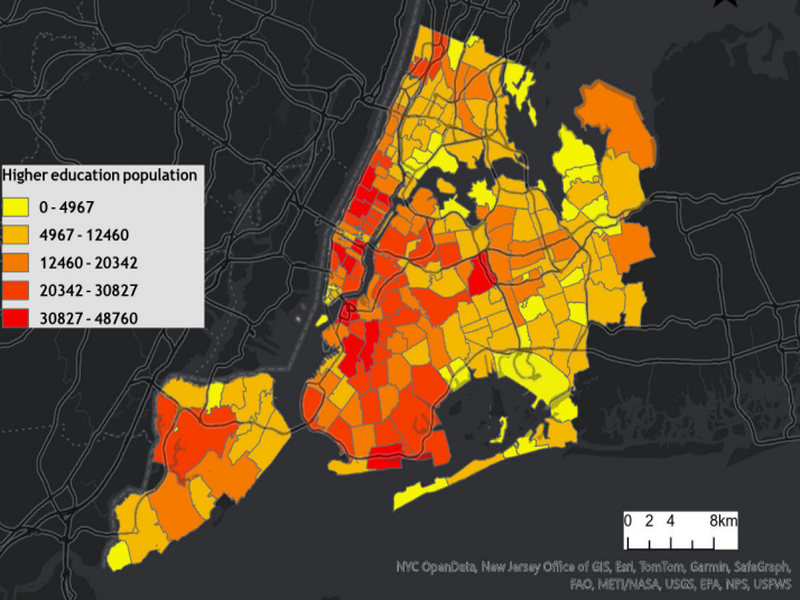
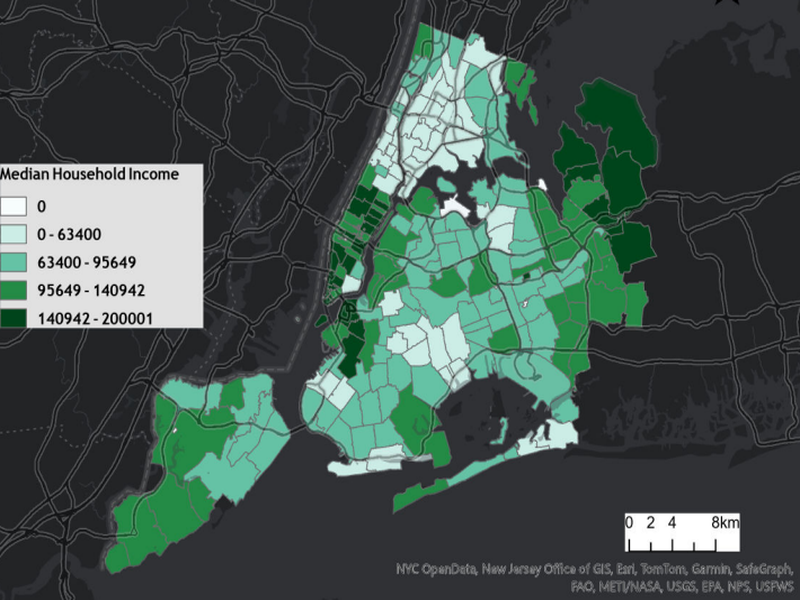
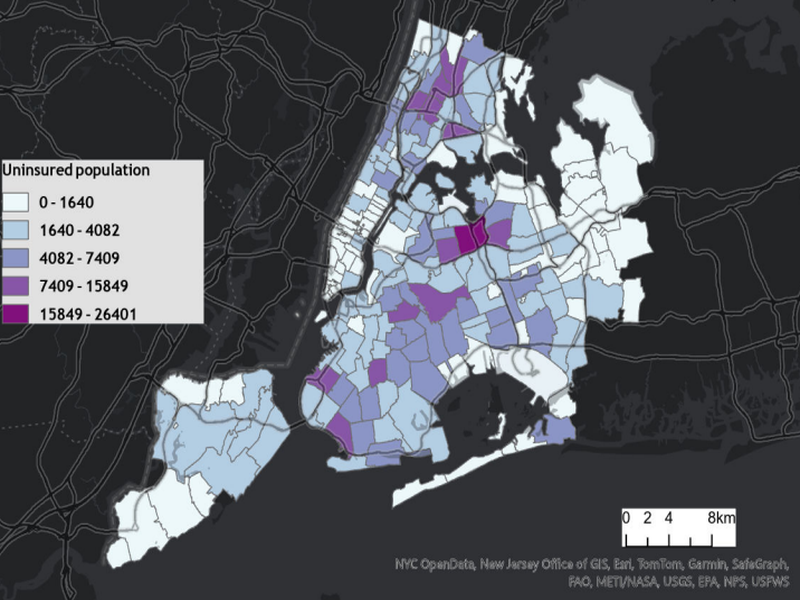
I collected socioeconomic data for New York City from the Census Bureau and ArcGIS Enrich Tool, including population density, median household income, educational attainment, and health insurance coverage. Using this data, I created separate maps to visualize the distribution of each factor across the city.
By calculating the number of mental health resources in each area, I derived the mental health resource density, adding it as a key variable to my analysis. This resulted in a total of five variables: population density, higher education levels, uninsured population, median income, and mental health resource density.
Implementation
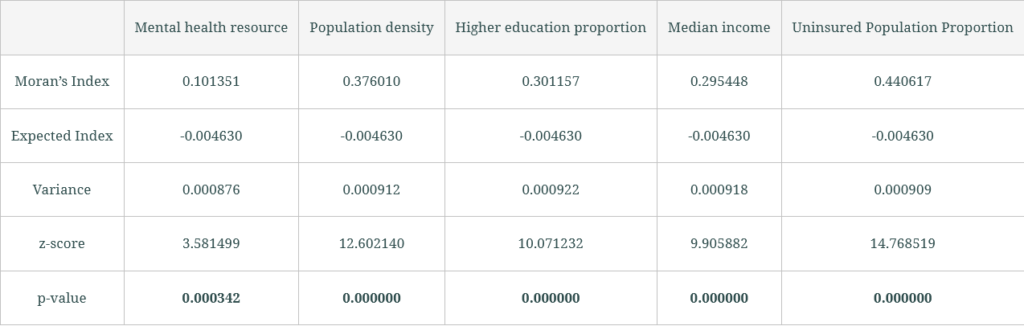
To examine spatial patterns, I conducted a Moran’s I analysis for each variable, assessing whether similar values were clustered, dispersed, or randomly distributed across New York City. Understanding these spatial distributions was essential for evaluating the relationship between socioeconomic factors and mental health resource accessibility, helping to identify areas with potential service gaps.
All variables exhibited significant spatial clustering, confirming that their distribution patterns were not random and had notable spatial dependencies.
Moran's I Analysis
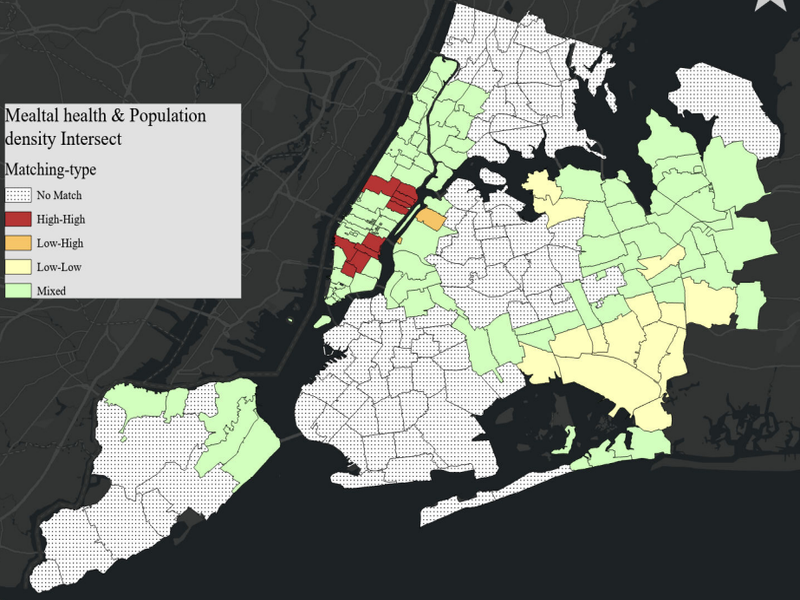
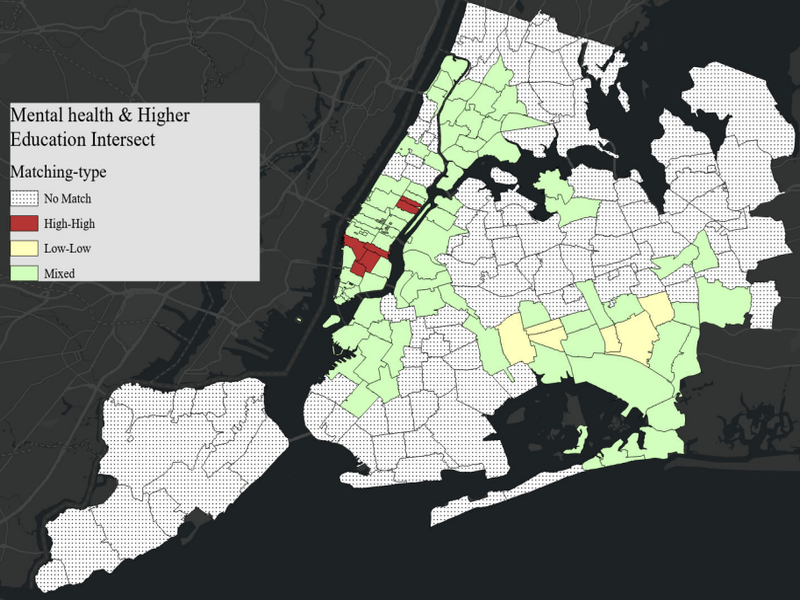
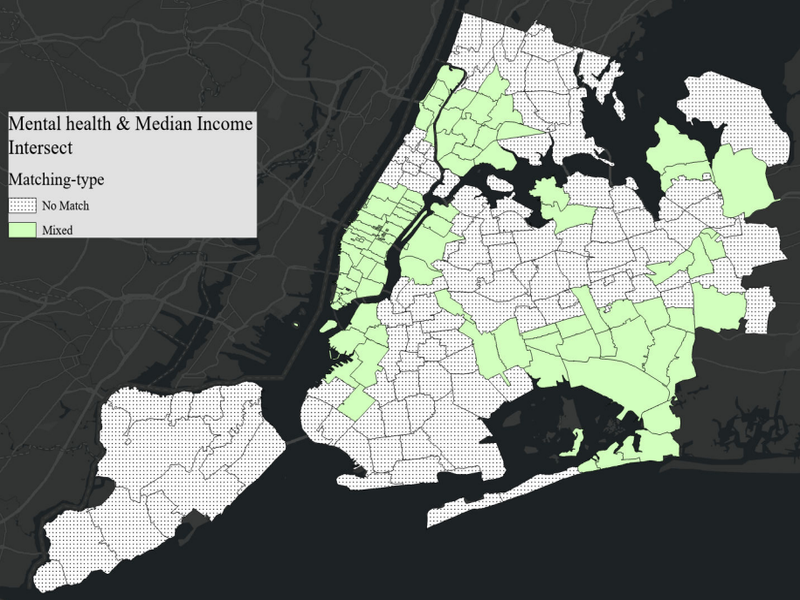
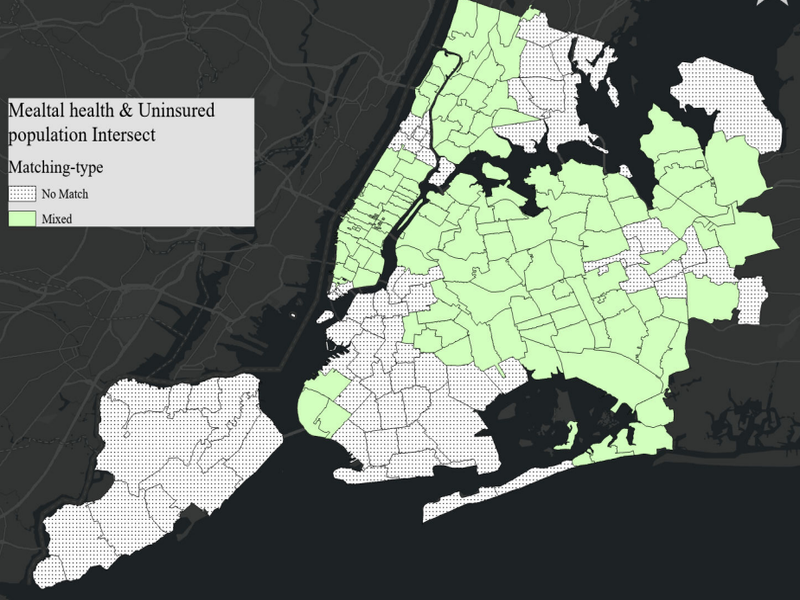
To examine the relationship between socioeconomic factors and mental health resource density, I conducted a Cluster and Outlier Analysis (Anselin Local Moran’s I) for each variable. The resulting maps highlight areas with significant high or low value clusters.
By comparing these clustering patterns with mental health resource density, I identified intersections and divergences, providing a clearer visual representation of areas with potential disparities in mental health resource accessibility.
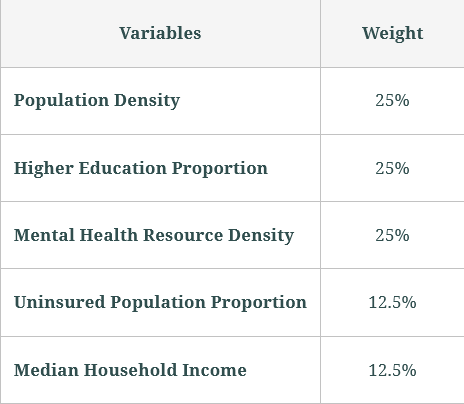
Based on the previous analyses, I conducted a Weighted Overlay Analysis to identify potential gaps in mental health resources. Population Density, Higher Education Proportion, and Mental Health Resource Density were assigned higher and equal weights due to their partial spatial overlap with areas of resource demand. In contrast, Uninsured Population Proportion and Median Household Income received lower but equal weights, as their clustering patterns showed less significant alignment with mental health resource distribution.
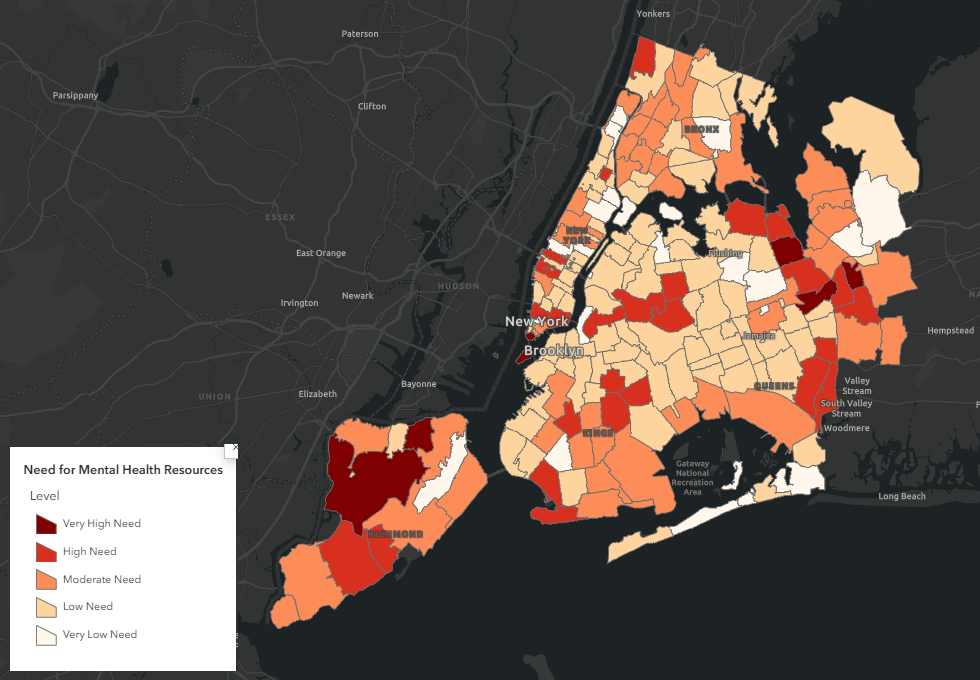
Final Deliverable
The final map presents five graded levels of mental health resource demand, using a color gradient to highlight areas with varying needs. This visualization provides valuable insights into resource distribution in NYC, identifying regions with potential service gaps and informing future allocation strategies.
However, limitations exist. Factors like housing prices and policy decisions were not included, and the analysis relies on existing resource distributions, which may overlook unmet demand. Additionally, the weight allocation lacks a theoretically optimal basis, affecting precision. Future studies should incorporate more variables and refine weighting methods to enhance accuracy and applicability.
The complete Story Map and final maps can be accessed here, providing an interactive exploration of mental health resource distribution and needs in New York City.