
Data Collection Process
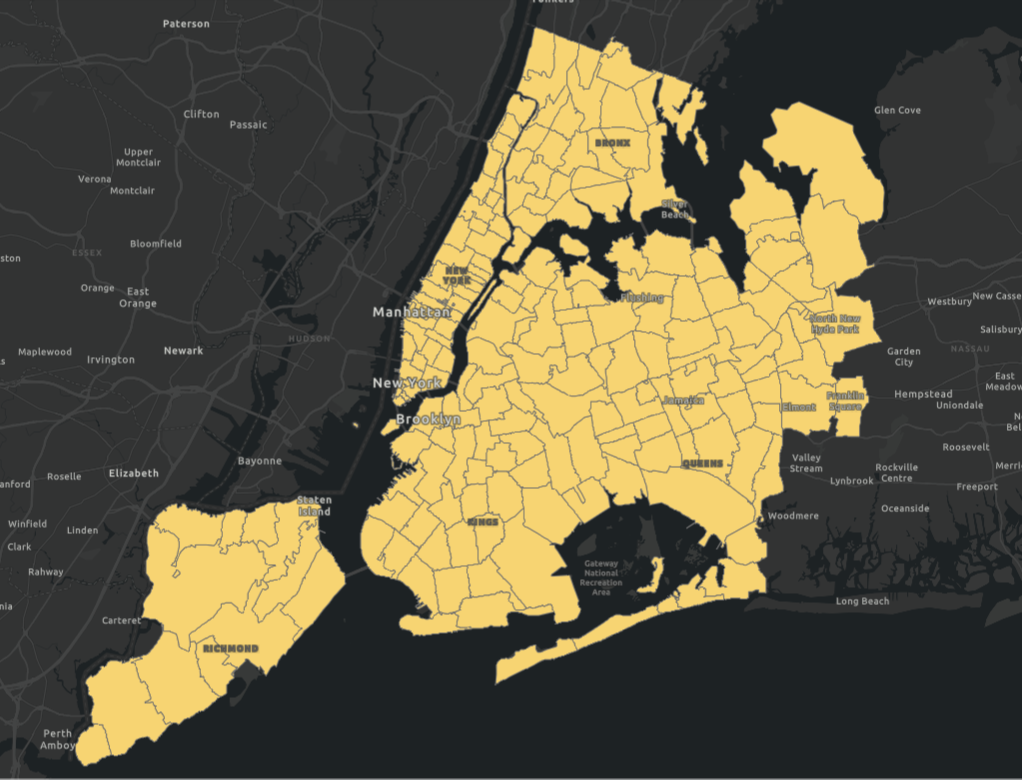
The first step was to conduct a more detailed analysis of regional differences by using ZIP Code areas to divide New York City into smaller regions.
This approach allows for a more granular examination of resource accessibility and demand in different neighborhoods.
From the Census Bureau, I obtained the latest shapefile containing ZIP Code area boundaries and imported it into ArcGIS.
The next step was to collect the locations of all mental health resources across New York City.
Since the licensing authority only provides a list of licensed professionals without their exact locations, I opted to use the Google Places API for data collection.
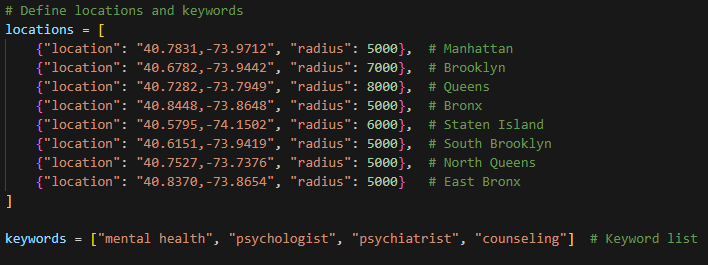
To ensure comprehensive coverage of the entire NYC area, I set multiple search center points, each with a defined radius.
The keywords used for the search included “mental health,” “psychologist,” “psychiatrist,” and “counseling” to capture a wide range of mental health resources.
The complete code for the API search process is available here
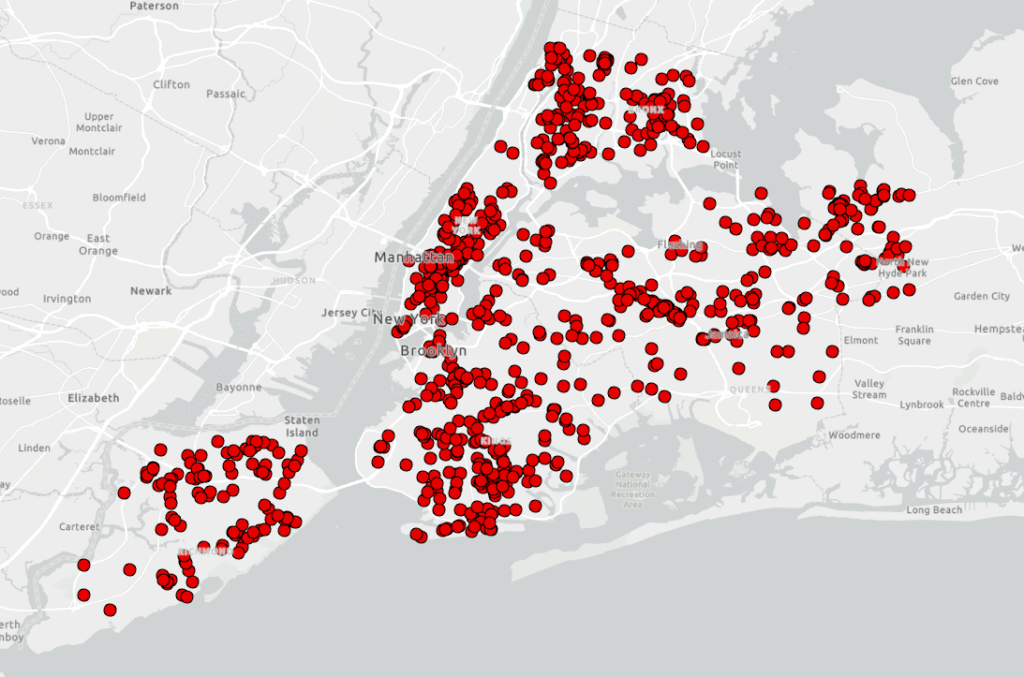
Using Python’s pandas package, I processed the collected data to remove duplicate entries, resulting in approximately 1,000 unique location records. These refined data points were then imported into ArcGIS, where I created a point layer for further analysis.
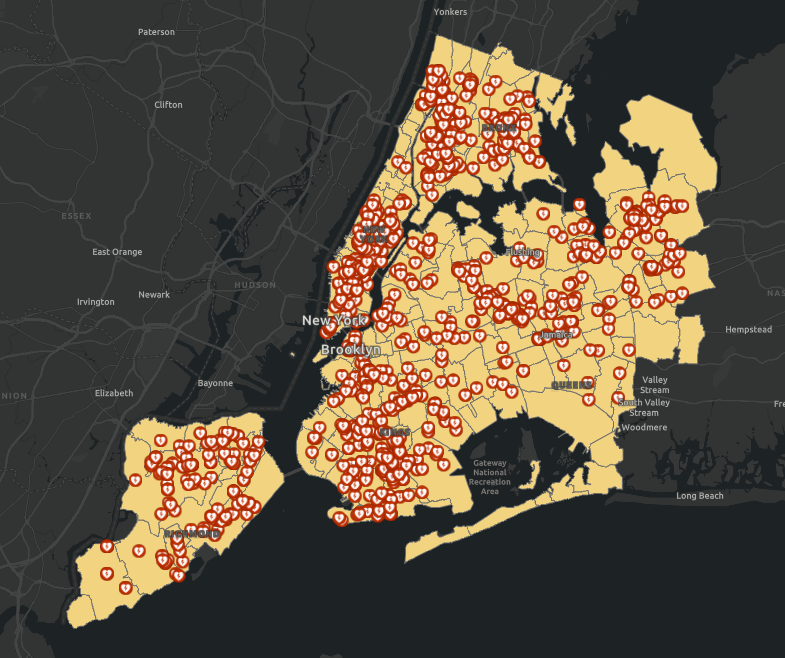
By overlaying the two layers, I ensured that the mental health resource locations intersected with the ZIP Code areas. After removing any redundant points, I obtained a comprehensive map showing the distribution of all mental health resources organized by ZIP Code.
Socioeconomic Factors and Data Preparation
In addition to mental health resource density, I also planned to incorporate other socioeconomic factors for analysis. Based on similar studies, I selected the following factors: population density, education level, insurance coverage, and median income.
Since I collected this data at different points in time, I used two different methods.
The first method involved using the Census Bureau’s filters to extract ZIP Code-level population totals. This approach required an additional step of importing the data into ArcGIS and joining it with my ZIP Code layer.
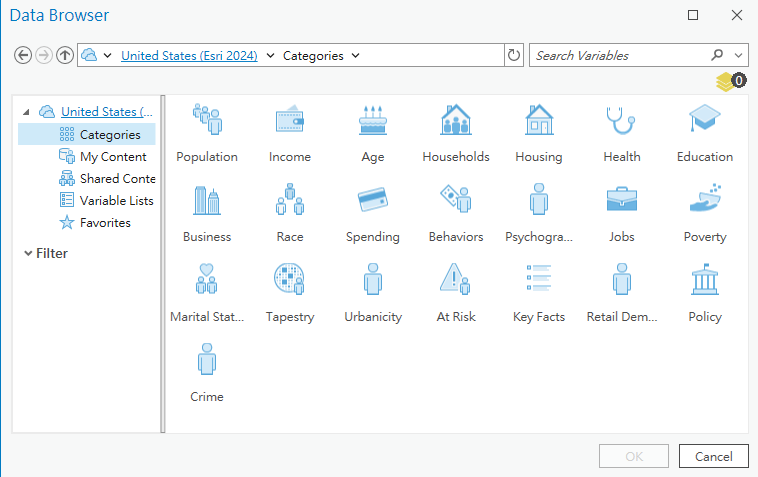
The second method, which I used later, involved the ArcGIS Enrich tool to directly retrieve data. While this method is more convenient, it does require the use of credits.

The maps of socioeconomic factors are as follows:


The maps classify the higher education population, uninsured population, median household income, and population density. To make these data comparable and calculable, I normalized and inverted them individually. With this preparation complete, we could proceed with the analysis.