
Spatial Analysis
I conducted a Moran’s I analysis for each of the five variables. Moran’s I is a statistical measure used to assess the spatial autocorrelation of a variable, determining whether similar values are clustered, dispersed, or randomly distributed across a geographic area.
I applied Moran’s I to population density, higher education levels, uninsured population, median income, and mental health resource density to identify whether these variables exhibited significant spatial clustering within New York City. This step was crucial to understanding the spatial patterns of these variables and to evaluate their potential relationship with the distribution of mental health resources.
| Mental health resource | Population density | Higher education proportion | Median household income | Uninsured Population Proportion | |
|---|---|---|---|---|---|
| Moran’s Index | 0.101351 | 0.37601 | 0.301157 | 0.295448 | 0.440617 |
| Expected Index | -0.00463 | -0.00463 | -0.00463 | 0.00463 | -0.00463 |
| Variance | 0.000876 | 0.000912 | 0.000922 | 0.000918 | 0.000909 |
| z-score | 3.581499 | 12.60214 | 10.071232 | 9.905882 | 14.768519 |
| p-value | 0.000342 | 0.000000 | 0.000000 | 0.000000 | 0.000000 |
Comparing Clustering Patterns
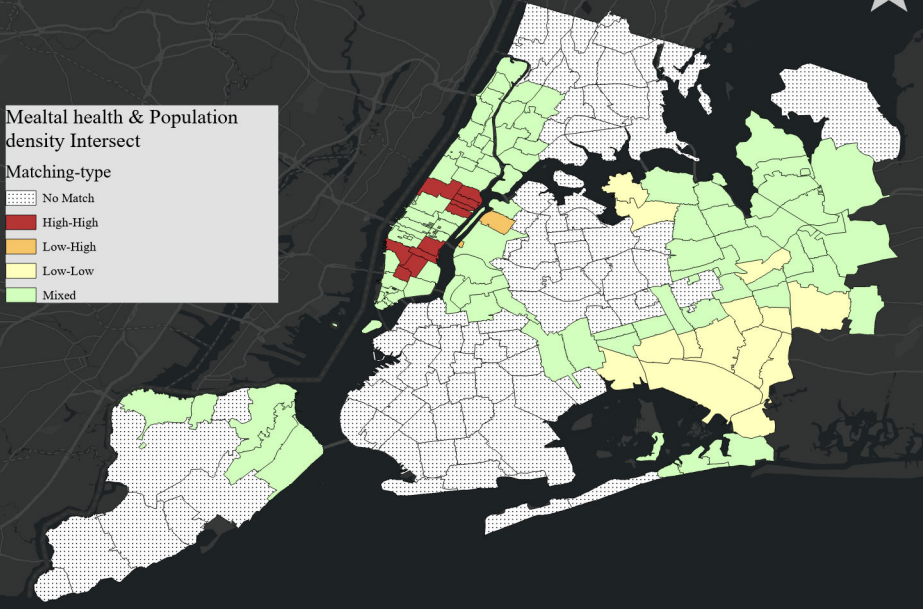
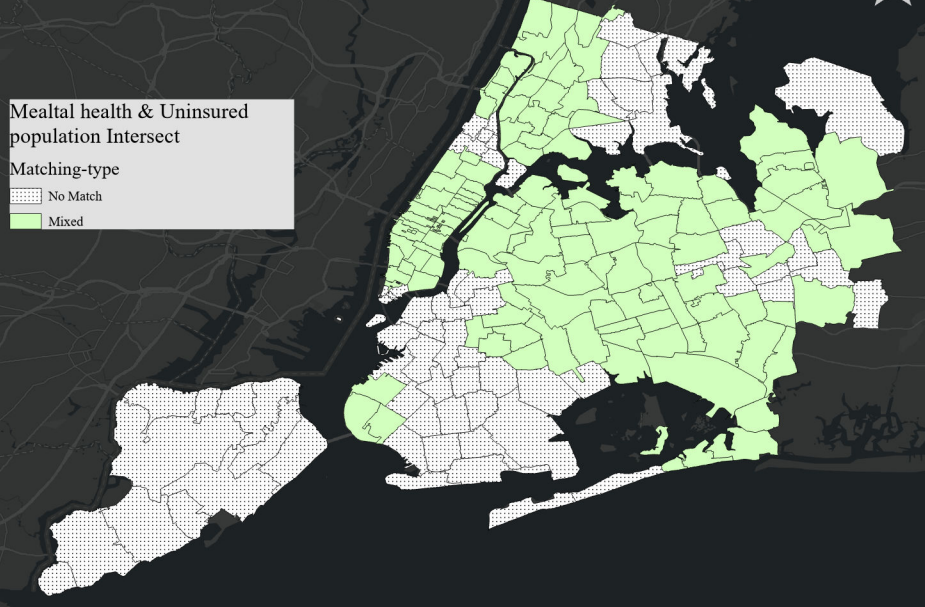
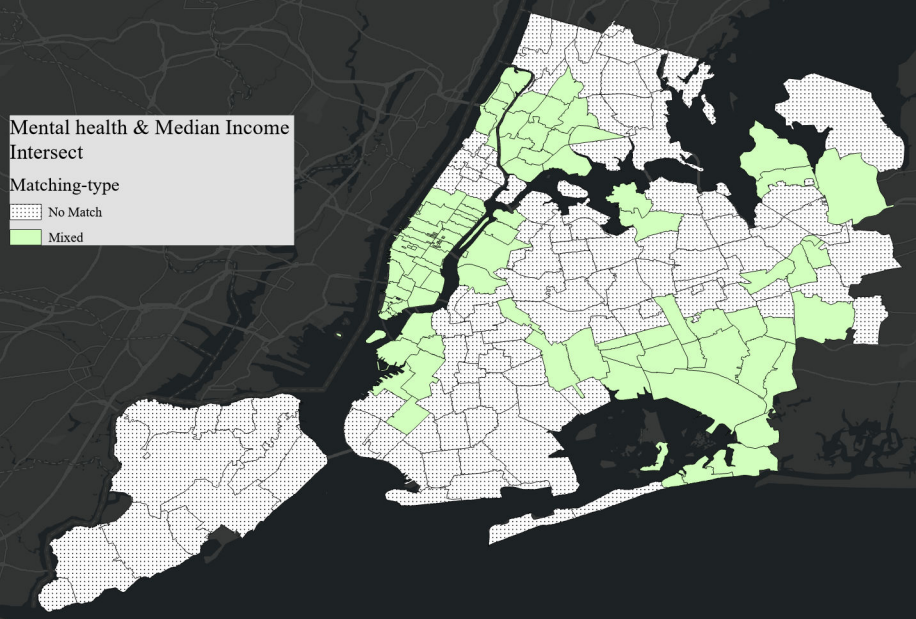
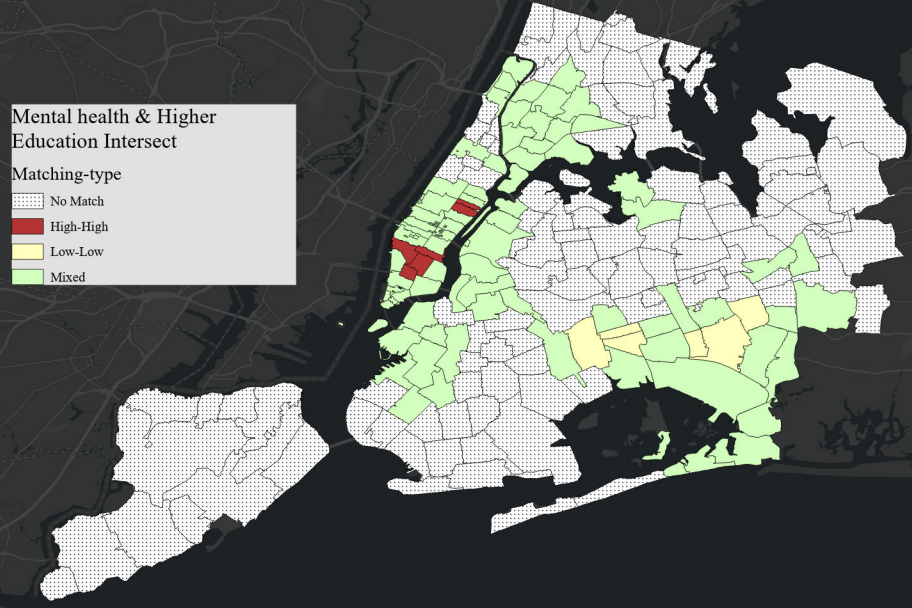
To further explore the relationship between these socioeconomic variables and mental health resource density, I performed a Cluster and Outlier Analysis (Anselin Local Moran’s I) for each variable. The resulting spatial clustering maps highlight areas where high or low values are geographically concentrated.
To identify potential correlations, I compared the clustering results of these socioeconomic variables with the clustering patterns of mental health resource density. The overlay maps below illustrate the intersections of clustering patterns, providing a clear visual representation of the areas where these variables align or diverge.
Weighted Overlay Analysis
Based on the results of the above analysis, I conducted a Weighted Overlay Analysis. I assigned equal but higher weights to Population Density, Higher Education Proportion, and Mental Health Resource Density, as they showed partial spatial overlap with areas of resource demand.
The remaining weights were distributed equally between the Uninsured Population Proportion and Median Household Income, as their clustering patterns exhibited less significant overlap with mental health resource density.
| Variables | Weight |
|---|---|
| Population Density | 25% |
| Higher Education Proportion | 25% |
| Mental Health Resource Density | 25% |
| Uninsured Population Proportion | 12.5% |
| Median Household Income | 12.5% |
The final map visualizes the results using five graded levels of demand, represented by a color gradient, providing a clear depiction of areas with varying levels of mental health resource needs.

Conclusion
This project provides valuable insights into the spatial distribution of mental health resource demand in New York City, highlighting areas with potentially unmet needs. The final map offers a useful starting point for identifying high-demand regions and informs future resource allocation decisions.
However, there are limitations to this analysis. Factors such as housing prices and policy decisions, which likely influence the current distribution of mental health resources, were not included. Additionally, as this study relies on the existing distribution of resources, it may not fully capture all areas with unmet demand.
Furthermore, the weight allocation applied in the analysis lacks a theoretically optimal basis, which may limit the precision and reliability of the results. Future studies should integrate additional variables and adopt more robust weighting methodologies to enhance the accuracy and applicability of the findings.
For more detailed maps and information, please click here.